


Jose Altuve used to be a speedy, slap hitting middle infielder who would swipe 30 bases while batting .300. He “fell” to .298 this season, which of course is fine and basically right on pace, but he stopped running (he had never failed to steal at least 17 bases before attempting just 11 steals this season – six successful). So, the loss of speed is a legit concern for Altuve, but look at what he ended up doing to compensate – he turned into a home run hitter. Let’s explore the metamorphosis that has occurred.
THE EVOLUTION OF ALTUVE
Jose Altuve hit two homers in 57 games as a rookie.
In 2012 he hit seven homers in 147 games.
In 2013 he hit five homers in 152 games.
In 2014 he hit seven homers in 2014
That’s 21 homers over 514 games covering 2,083 at-bats.
In 2015 he hit 15 homers in 638 at-bats go to 15/35.
In 2016 and 2017 he hit 24 homers in each season. Remember, he hit 21 homers his first four years.
In 2018 he fell back to 13 bombs in 137 so it appeared that 20 homers was the likely output to expect in 2019.
In 2019 he stole a career worst six bases. He was also limited to a mere 124 games due to injury. So how many homers did he hit? Try thirty-one. In 500 at-bats he hit 31 homers. Recall, this is the same man that hit 36 homers his first 2,721 at-bats.
So, what the hell happened? After all, it’s not like he grew a he’s still one of the smallest players in the game at 5’8” and about 170 lbs.
THE SWING
Let’s look at the evolution of his ground ball rate over the years.
| GB-Rate | |
| 2011 | 50.0 |
| 2012 | 52.7 |
| 2013 | 49.2 |
| 2014 | 47.5 |
| 2015 | 46.7 |
| 2016 | 41.6 |
| 2017 | 47.0 |
| 2018 | 46.0 |
| 2019 | 49.9 |
Huh. His ground ball rate in 2019 was actually a seven-year high. Obviously if that was all the data you had to go by, you 100 percent would not expect that number to lead to a career best homer total. Remember, Altuve hit 31 homers, seven more than ever before, despite an 8-year low in at-bats as well. Also remember that he never hit more than seven homers his first four seasons.
The fly ball rate must have gone up.
| FB-Rate | |
| 2011 | 29.6 |
| 2012 | 27.1 |
| 2013 | 28.3 |
| 2014 | 29.7 |
| 2015 | 35.2 |
| 2016 | 32.2 |
| 2017 | 32.7 |
| 2018 | 30.0 |
| 2019 | 32.5 |
There was no growth in the fly ball rate last season.
Well, it must be the homer to fly ball thing then, right?
| HR/FB | |
| 2011 | 3.6 |
| 2012 | 5.1 |
| 2013 | 3.2 |
| 2014 | 3.9 |
| 2015 | 7.4 |
| 2016 | 13.0 |
| 2017 | 14.6 |
| 2018 | 9.6 |
| 2019 | 23.3 |
A quick review.
Homer to fly ball ratios tend to level off over time with players establishing their own baseline. The best way to get a guess of the future, i.e. where the number is likely to settle, is to do something simple like using a rolling three-year average when possible. In the case of Altuve we would be looked at a rate around 12-13 percent we were trying to predict his ’19 output. So, when you see nearly a doubling of the rate (we saw more than a doubling if we compared 2018 to 2019), you know that we need to do more digging to explain what is going on. We need to try and determine (A) If ’19 was just an outlier and regression should be expected in 2020? (B) If enough of his overall game changed that Altuve should be though of as a guy likely to replicate his HR/FB rate next season.
Let’s look at Altuve’s launch angle over the years.
| Launch Angle | |
| 2015 | 10.5 |
| 2016 | 10.9 |
| 2017 | 9.1 |
| 2018 | 9.5 |
| 2019 | 8.8 |
Altuve hit 31 homers with his lowest recorded launch angle. That’s not very
logical now is it?
Maybe he hit the ball a lot harder?
| Exit Velocity | |
| 2015 | 85.8 |
| 2016 | 87.5 |
| 2017 | 85.5 |
| 2018 | 86.3 |
| 2019 | 86.1 |
Again, no dice. He did not hit the ball harder in terms of the average exit
velocity of his batted balls.
Perhaps his hard-hit rate (95-mph) surged?
| Hard-Hit | |
| 2015 | 28.8 |
| 2016 | 36.2 |
| 2017 | 27.6 |
| 2018 | 33.8 |
| 2019 | 34.5 |
He did have a three year best in this category, but his highest mark was in
2016 when he hit 24 homers. By the way, the league average is 34.5 percent,
smack dab on the mark Altuve posted last season.
So, nothing listed above truly supports that Altuve should have blown past his previous best in the homer column by such a massive amount.
Well…
Altuve had the highest pull rate of his career at 50 percent. His career mark is 42 percent, and the rate was 40.8 and 41.4 percent in 2017 and 2018. That certainly could lead to some help as pulling the ball, especially for a little fella, should help increase the homer rate. Some thoughts.
1 – He hit two balls that barely stayed fair right on the left field line. He also had another that was barely inside the foul pole.
2 – He hit two homers to dead center, but he only hit five homers to the right side of the middle of the field.
- Data from Fangraphs.
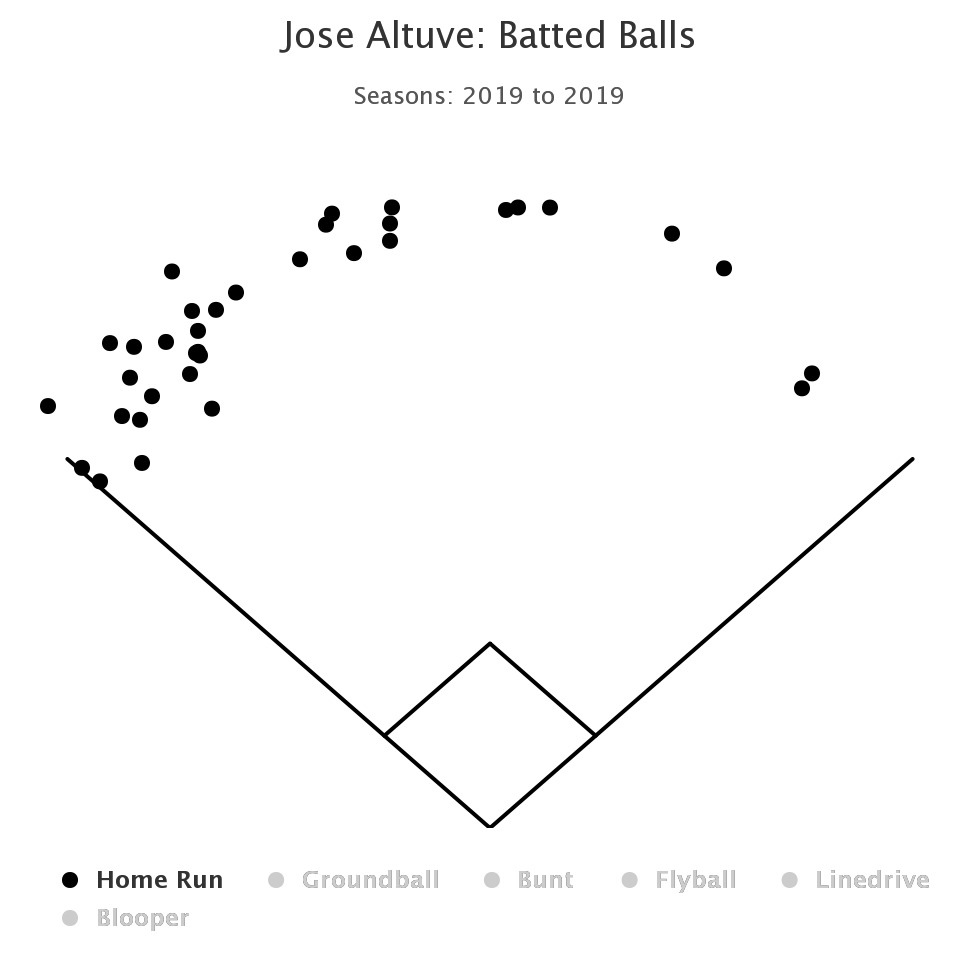
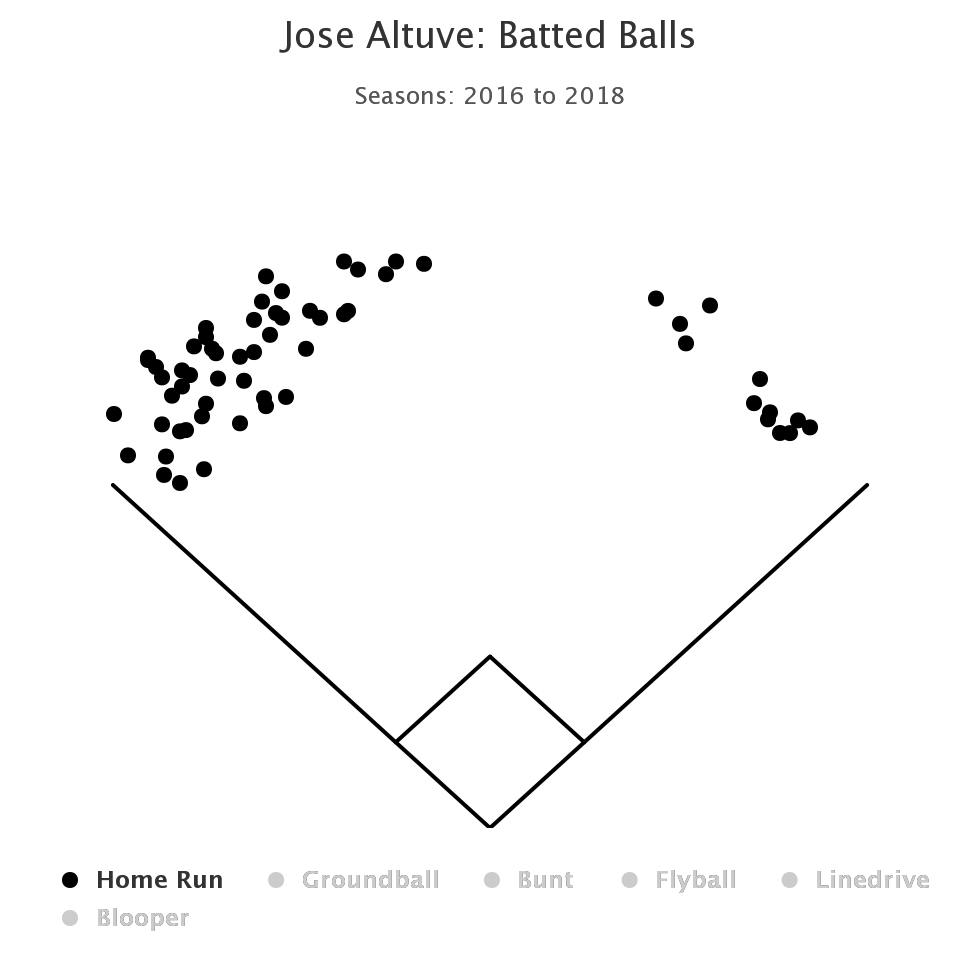
His spray chart for the homer really isn’t that different from what we saw with Altuve from 2016-18. In those three seasons he hit 12 homers to the right of the middle of the field.
Maybe he hit the ball a lot farther? Here are his average homer distance the last five seasons.
| HR Total | AVG Distance | |
| 2015 | 15 | 386 |
| 2016 | 24 | 397 |
| 2017 | 24 | 393 |
| 2018 | 13 | 399 |
| 2019 | 31 | 396 |
Nope, that isn’t it either as his homer distance was spot on his established average.
In the end, it’s extremely difficult to envision a scenario where Altuve hits 30 homers yet again. The data suggests that his enlarged HR/FB ratio in ’19 was the main driver of his homer increase.
Ray Flowers can be heard Monday-Thursday 8-10 PM EDT, and Friday’s from 10-12 PM EST and Sunday’s at 9-11 pm EST on SiriusXM Fantasy Sports Radio (Sirius 210, XM 87). Follow Ray’s work on Twitter (@baseballguys) and be sure to listen to his podcast work too.